
Read the Operations dashboard
See which projects need attention, stage by stage, and open the work behind each one.
The Operations dashboard shows every active project as a small colored card under its stage. Use it to see which projects need someone today, which stages are running slow, and how each department's work is going.
Before you start
- Every built-in role can open the dashboard. It shows the projects your role can see. By default, Owner, Admin, Sales Manager, Operations Manager, and Operations User see every project. Sales User, Technician, and Member see only the projects they own.
- A project appears only if it was built from a project template and is Draft or Active.
- The Money view needs a role that can see billing. Without one, the Projects and Money buttons don't appear.
Open the dashboard
Click Operations in the top bar. The dashboard is the first page. From any other Operations page, click Dashboard at the top of the sidebar.
The page refreshes about once a minute, and again when you return to its browser tab. The address keeps your template, stage, and filters, so you can send someone a link to what you're looking at. They see what their own role allows.
Choose a template
The dashboard shows one project template at a time. It opens on the template with the most active projects.
- Click the template name at the right of the Stages and Departments tabs.
- Click a template in the list. Each row shows how many projects are Active and how many Needs attention.
Read the stage strip
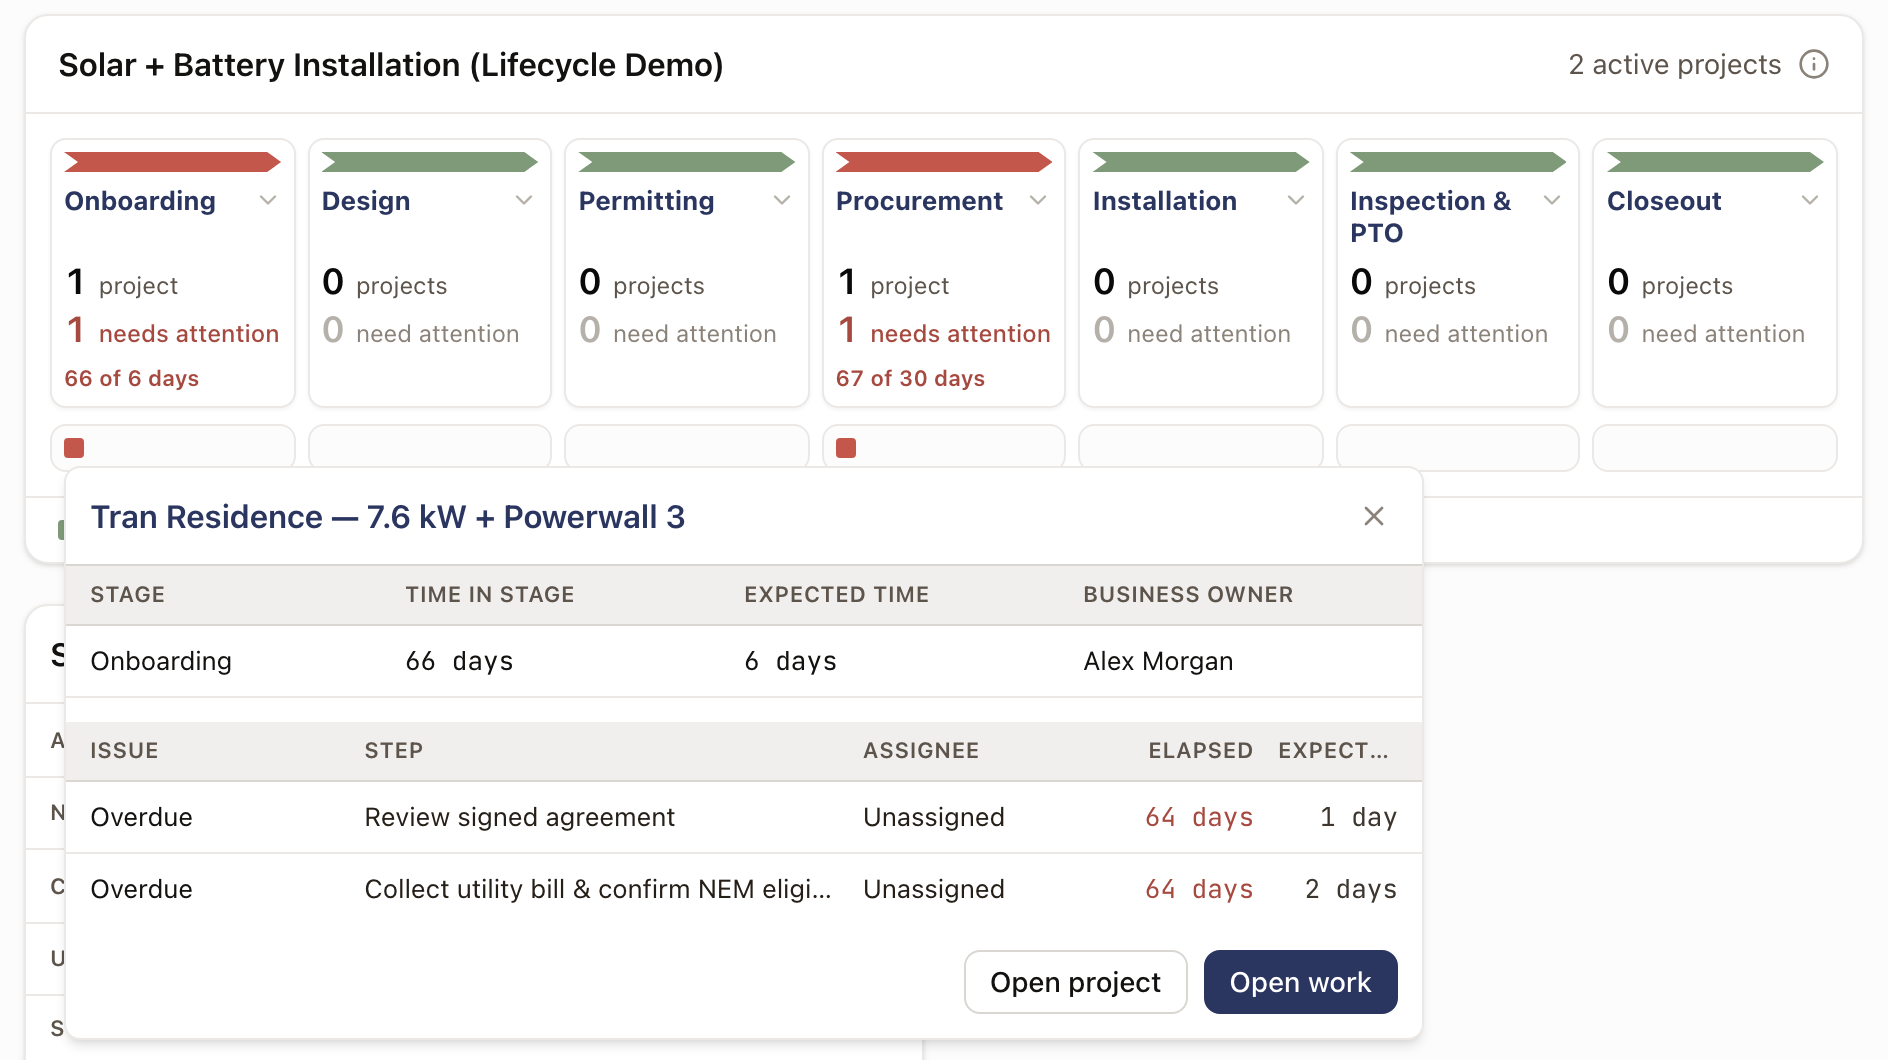
The strip has one block for each stage of the template, in order. A project whose current stage isn't one of the template's stages sits in an extra block at the end, such as Other stages.
Each block shows:
- A green, yellow, or red bar for the stage's health. A small chevron between blocks shows the stages run left to right.
- The stage name.
- How many projects are in the stage, and how many need attention.
- The average number of days those projects have been in the stage, against the stage's expected time, such as 16 of 12 days. A stage with no expected time shows only the average.
Under each block is one small square for each project in the stage, problems first. The red number beside the Stages tab counts the projects that need attention in the template.
Stage colors
Hover the information icon next to the project count to see the rule.
- Red: the average time in the stage is more than 1.25 times its expected time, or more than 25% of its projects need attention.
- Yellow: the average is over the expected time, or 10% or more of its projects need attention.
- Green: neither.
A stage's expected time adds up the expected times of its steps. A permit, application, or plan set step uses the expected times that apply as it moves toward done. They come from Settings → Operations → Expected times, a jurisdiction's permit days, and an application type's milestone days. See Set expected times for waiting work. Any other step uses the Estimated duration set in the project template. A step that only some projects get is left out.
Project squares
| Square | Meaning |
|---|---|
| Green: On track | Nothing to flag. |
| Yellow: Nearing expected time | A step has used 80% or more of its expected time, or is due within 2 days. |
| Red: Action required | A step needs someone. |
| Red with stripes: On hold | The project has an open hold. |
A project with an open hold shows as On hold even if it also has other problems. A project needs attention when it is Action required or On hold.
Action required uses the same problems the project's Work tab flags: a permit that was returned for revision, rejected, or expired; an application that needs more, was denied, or expired; a plan set returned for revision; a failed inspection; a report awaiting review; a change order waiting; an overdue step; and a step past its expected time.
Hover or focus a square to see the project and its main problem. Use the arrow keys to move between the squares in a stage, and press Enter to open one.
Open a project square
Click a square. A panel opens beside it with:
- The project number and name. Click it to open the project.
- Stage, Time in stage, Expected time, and Business Owner.
- The project's problems, worst first, with Issue, Step, Assignee, Elapsed, and Expected. Elapsed turns red when it is past Expected.
- Open project, and a button for the worst problem, such as Open permit or Resolve hold.
Press Escape to close the panel. Most problem buttons open the record in a drawer on the dashboard. Resolve hold and Open change order open the project.
Open a stage
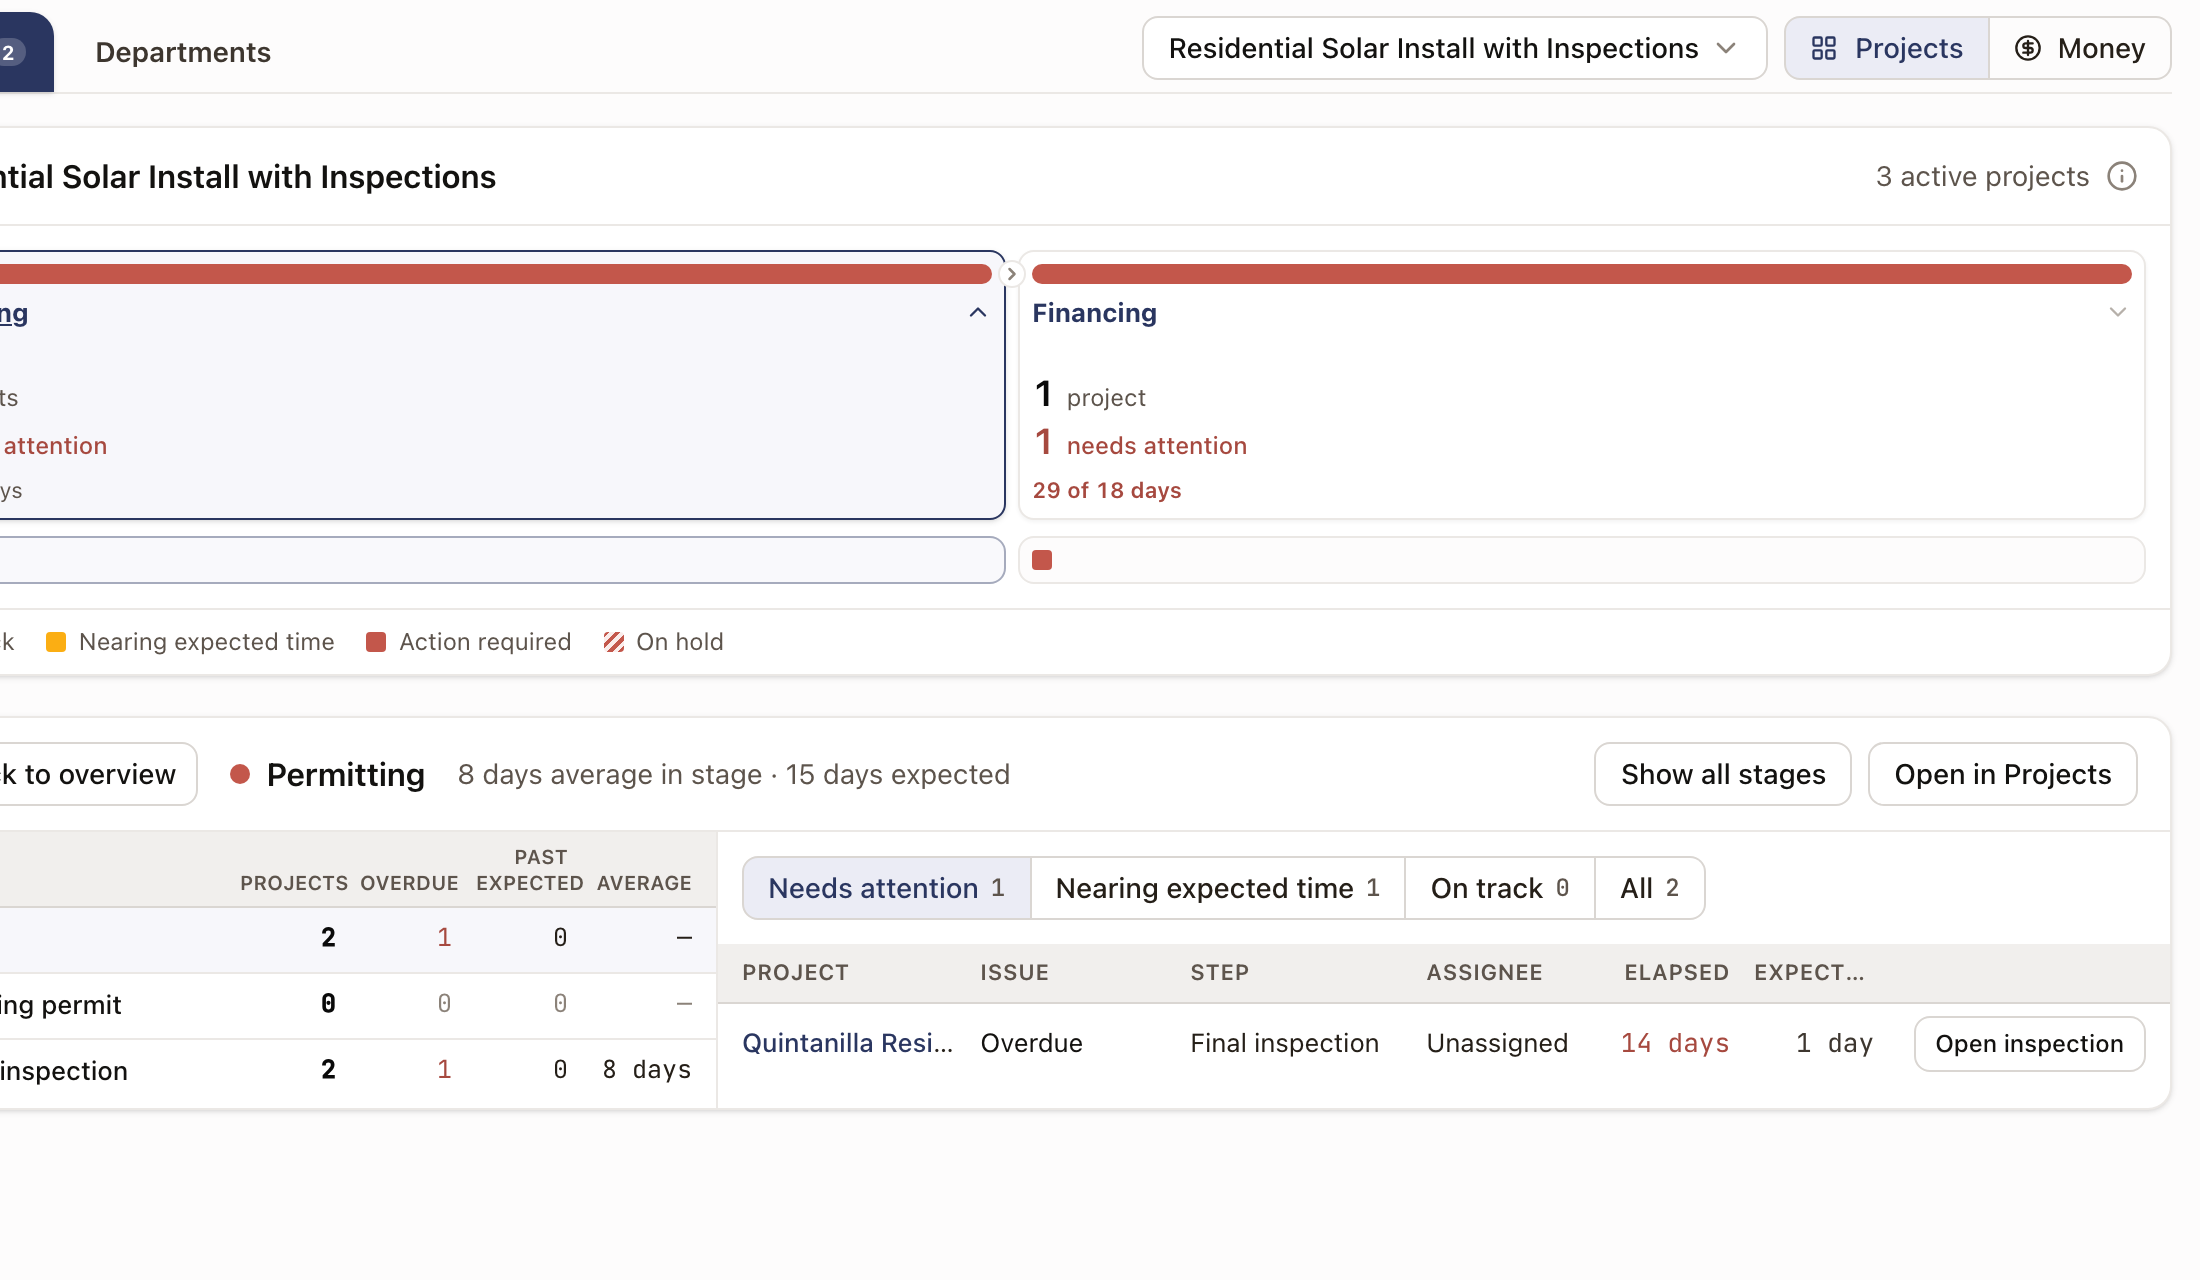
Click a stage in the strip. Its detail opens under the strip.
- The header shows the stage name and its average time in the stage against its expected time. Click Back to overview to close it. Show all stages opens the list of everything that needs attention. Open in Projects opens the Projects board for this template.
- On the left, the Steps list has Step, Projects, Overdue, Past expected, and Average. Each project counts on one step: the step its worst problem is on, or the step it is working. A project on hold counts under On hold, and a project with nothing open counts under No open step. The first row, All steps, adds them up. Click a step to see only its projects.
- On the right, the buttons Needs attention, Nearing expected time, On track, and All show how many projects are in each state. The list opens on Needs attention when the stage has any. It opens on All when nothing needs attention, and when you pick a step.
- Under the buttons, the projects are listed worst first, with Project, Issue, Step, Assignee, Elapsed, and Expected, and an action button such as Open work order.
See everything that needs attention
On the overview, click Show all beside Needs attention in the Summary card. Inside a stage, click Show all stages. The Needs attention list has one table for each stage, in order. Click a stage name to open that stage.
The buttons above each table filter its projects by kind of problem, with a count for each. Each project appears once, with its worst problem. A table shows its first five projects. Click View all to see the rest and Show fewer to collapse it. Click Back to overview to return. When nothing needs attention, the list reads No projects need attention.
Read the overview
With no stage open, two cards sit under the strip.
Summary has these rows:
- Active projects.
- Needs attention, with Show all when the number is above zero.
- Contract Value and Uninvoiced, if you can see billing.
- Stage health: one block for each stage, in its color.
- Stages: how many stages the template has.
- Slowest stage: the stage furthest past its expected time. It shows a dash when no stage is over.
Trends appears only when something has gotten worse. It lists what was at least 30% worse in the last 30 days than in the 30 days before, across at least 5 projects, largest change first. The columns are Trend, Last 30 days, Prior 30 days, Change, and View. The trends cover the selected template's projects, finished ones included:
- A stage's average time in the stage.
- A jurisdiction's average permit approval time.
- Plan sets returned for revision.
- Failed inspections.
- A step's average step time.
- Holds placed by hold reason group, such as Holds placed · Money.
A trend that was zero before reads Up from 0. Click View on a stage trend to open that stage. For the others, View lists the projects behind the last 30 days. A permit trend also links to Open the jurisdiction’s permits. The page works trends out each time you open it. Nobody is notified.
Switch to Money
If your role can see billing, click Money, next to the template name.
- The strip's header shows the template's Contract Value, Invoiced, Uninvoiced, and Needs attention, which is the uninvoiced amount on projects that need attention.
- Each stage block shows the same four amounts for its projects. Large amounts are shortened, such as $5.7M. Hover an amount to see it in full.
- Project lists gain an Uninvoiced column.
The amounts follow each project's Billing tab. Uninvoiced is Contract Value minus Invoiced. Void and written-off invoices don't count as invoiced. Click Projects to switch back.
Departments tab
Click Departments. The table has one row for each department, across every template, so the template list is hidden here. Set up departments in Group your team into departments.
| Column | What it shows |
|---|---|
| Department | The department's name. |
| Managers | Its managers. |
| People | How many people are in it. |
| Open | Its open work: steps assigned to its people that can be worked now, plus holds and waiting change orders on projects its people own. For a project on hold, only its holds count, for its owner. |
| Progress | A bar that splits the open work into Action required, On hold, Nearing expected time, and On track. Hover it for the counts. |
| Action required | How many of the open items need action. |
| On hold | How many open holds sit on projects its people own. |
| Health | Off track when more than 25% of the open work is Action required or On hold. At risk at 10% or more. On track below that. No open steps when it has none. |
Hover the information icon next to Departments to see how departments are counted. Open steps count for the departments of the person they are assigned to. Holds count for the departments of the project's owner. Someone in two departments counts in both, so department totals overlap.
A department appears here once at least one of its people is assigned a step on an active project. Under the table, Needs attention lists each department's projects whose problems belong to its people. A project can appear under more than one department.
Narrow the dashboard by owner or department
Roles that can see all projects get a picker at the top right of the page. It reads All Records at first. Choose My Records, My departments, a department under Departments, or people under Specific people.
The dashboard keeps the projects whose owner matches. Choosing a department keeps the projects owned by anyone in that department's People. The picker lists only departments whose people are assigned steps on active projects. The picker never adds a project your role can't see. It also narrows the Departments tab to the matching projects.
Common problems
The page says "No active projects." No project built from a template is Draft or Active, or the picker is narrowing too far. Choose All Records. Projects without a template, and Completed, Cancelled, or Closed projects, don't appear.
The page says "You don’t have access to projects." Your role can't see projects. Ask an Owner or Admin.
The page says "The dashboard didn’t load." Reload the page.
The Money switch is missing. Your role can't see billing.
A department is missing from the Departments tab. It appears once one of its people is assigned a step on an active project. Check its People in Settings → Team → Departments.
Check it worked
Click Operations. The page reads Operations, with Stages and Departments tabs and one block in the strip for each stage of your busiest template.
Read and reset the clock on waiting work
See how long a permit, application, plan set, or waiting step has been in its status, and reset the clock or change its Expected time.
Place and resolve a project hold
Pause a whole project for a blocker such as an HOA or a customer's payment, edit the hold, and resolve it when the blocker clears.