
Find and review a site
Search the Sites list, open a site's drawer, and read its production, equipment, and connected devices.
Every Property with a monitoring subscription shows up as a Site. The Sites list is where you check on your whole fleet; a site's drawer is where you look at one customer's system in detail.
Before you start
Anyone with Monitoring access can view Sites. Editing a site's equipment or generating a report needs the Owner, Admin, or Operations Manager role by default.
Steps
- Go to Monitoring → Sites.
- Use the status filters at the top (All sites, Needs action, Healthy, At-risk, Needs connection, Suspended) or Search sites… to narrow the list. The table shows each site's Connection, Health, open Alerts, Subscription, and Last sync.
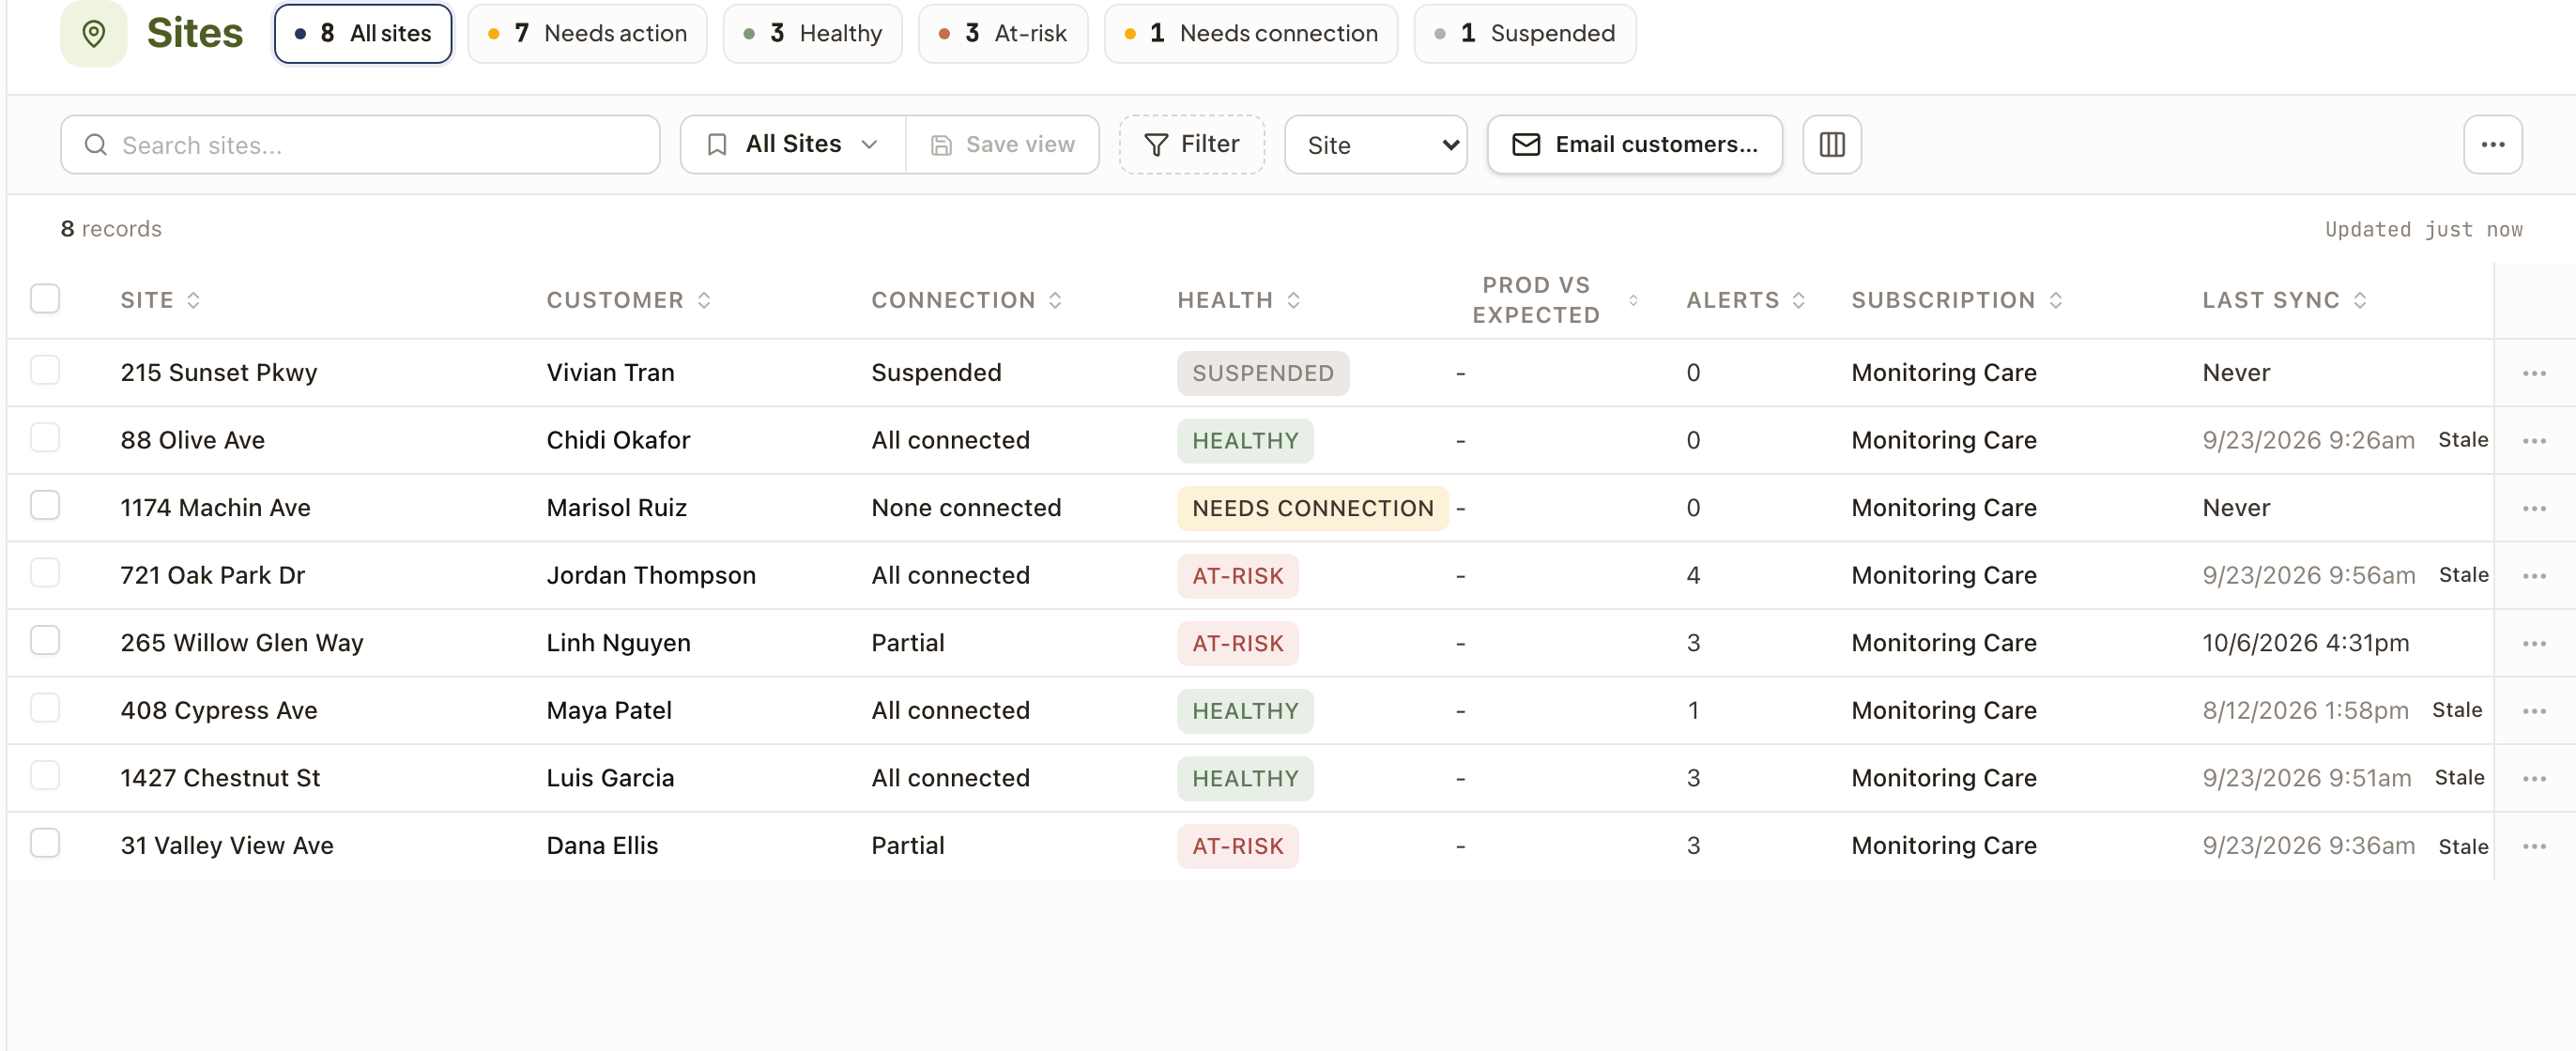
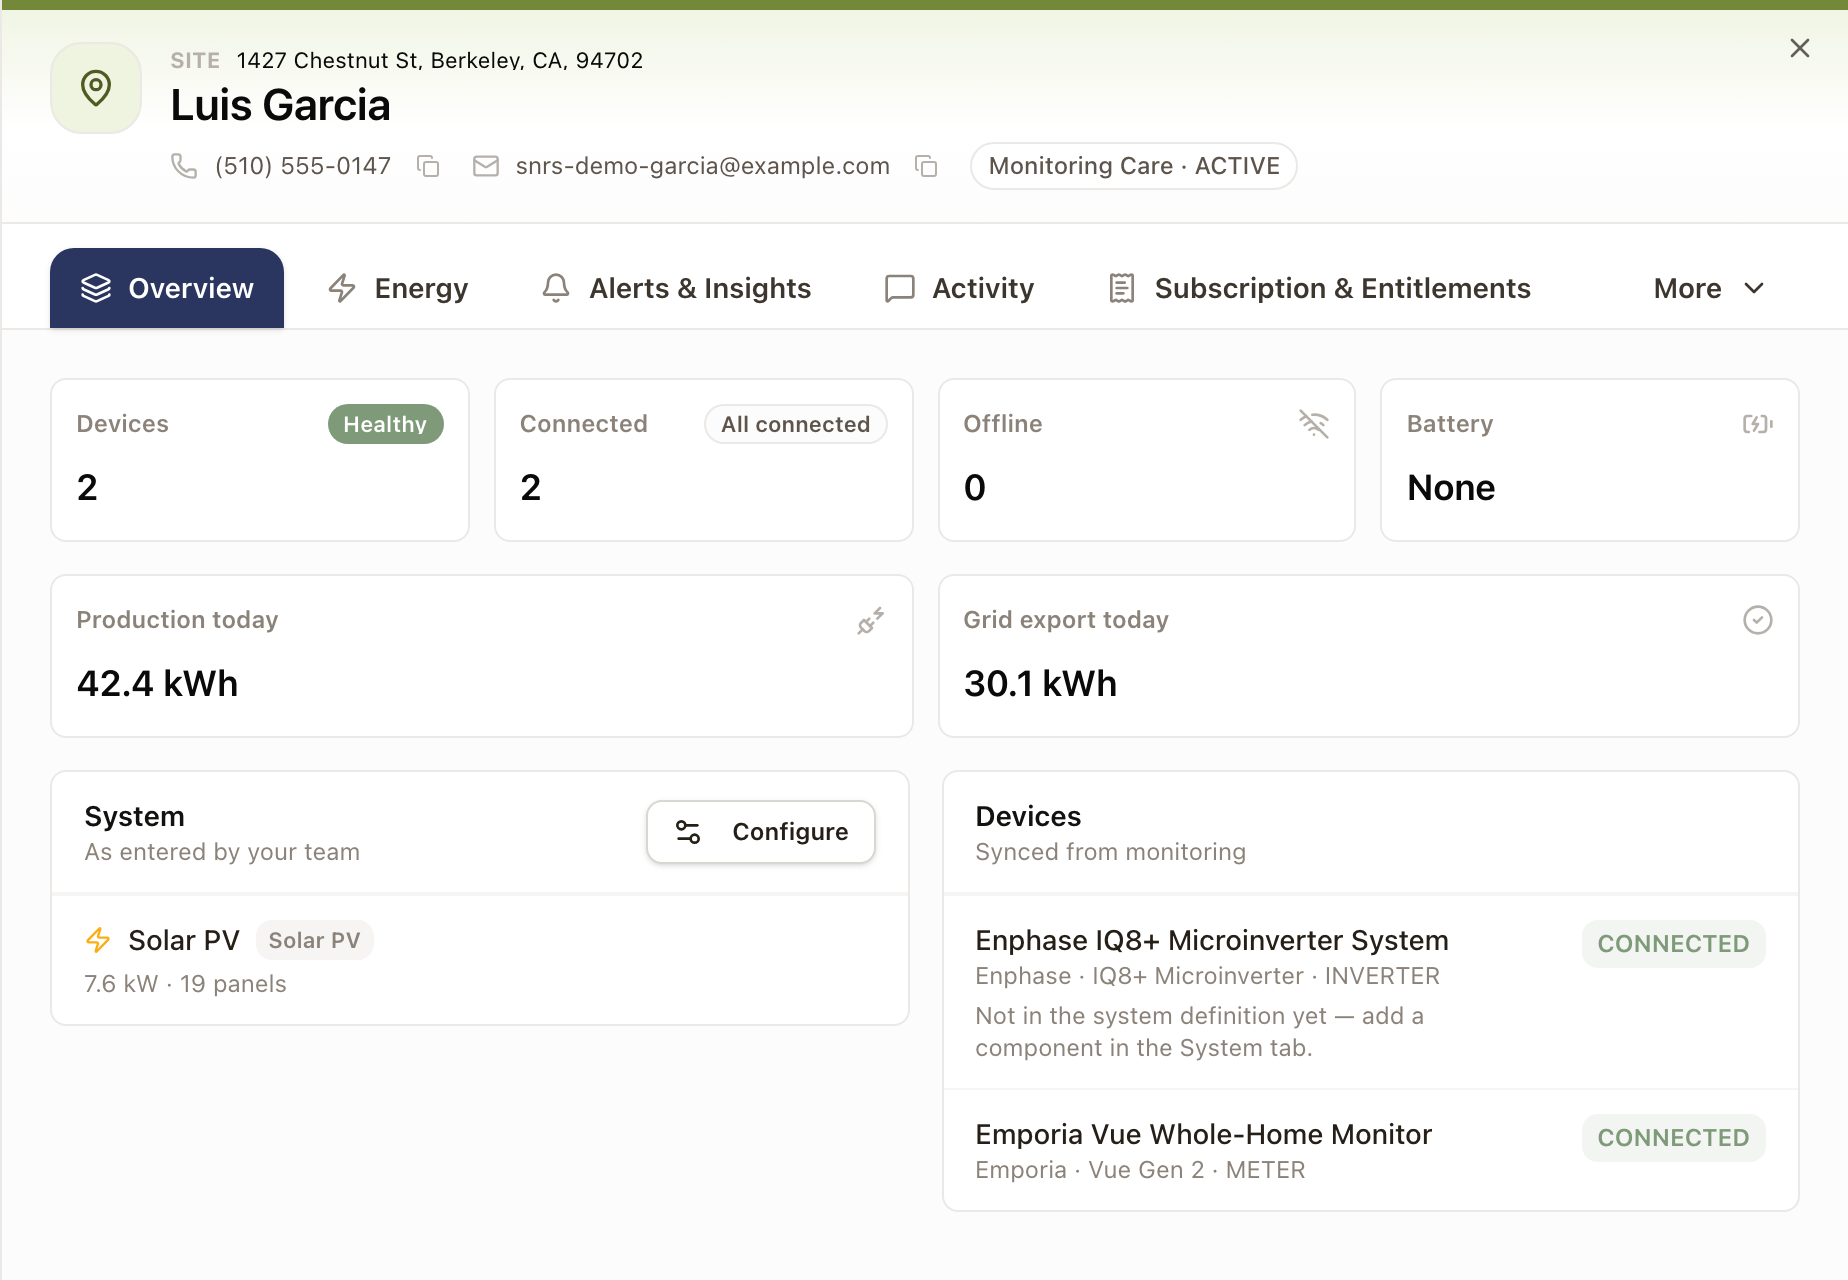
- Click a row to open that site's drawer. Overview shows device counts (Connected, Offline, Battery), today's Production and Grid export, and, side by side, the System your team entered and the Devices reported by the manufacturer's monitoring.
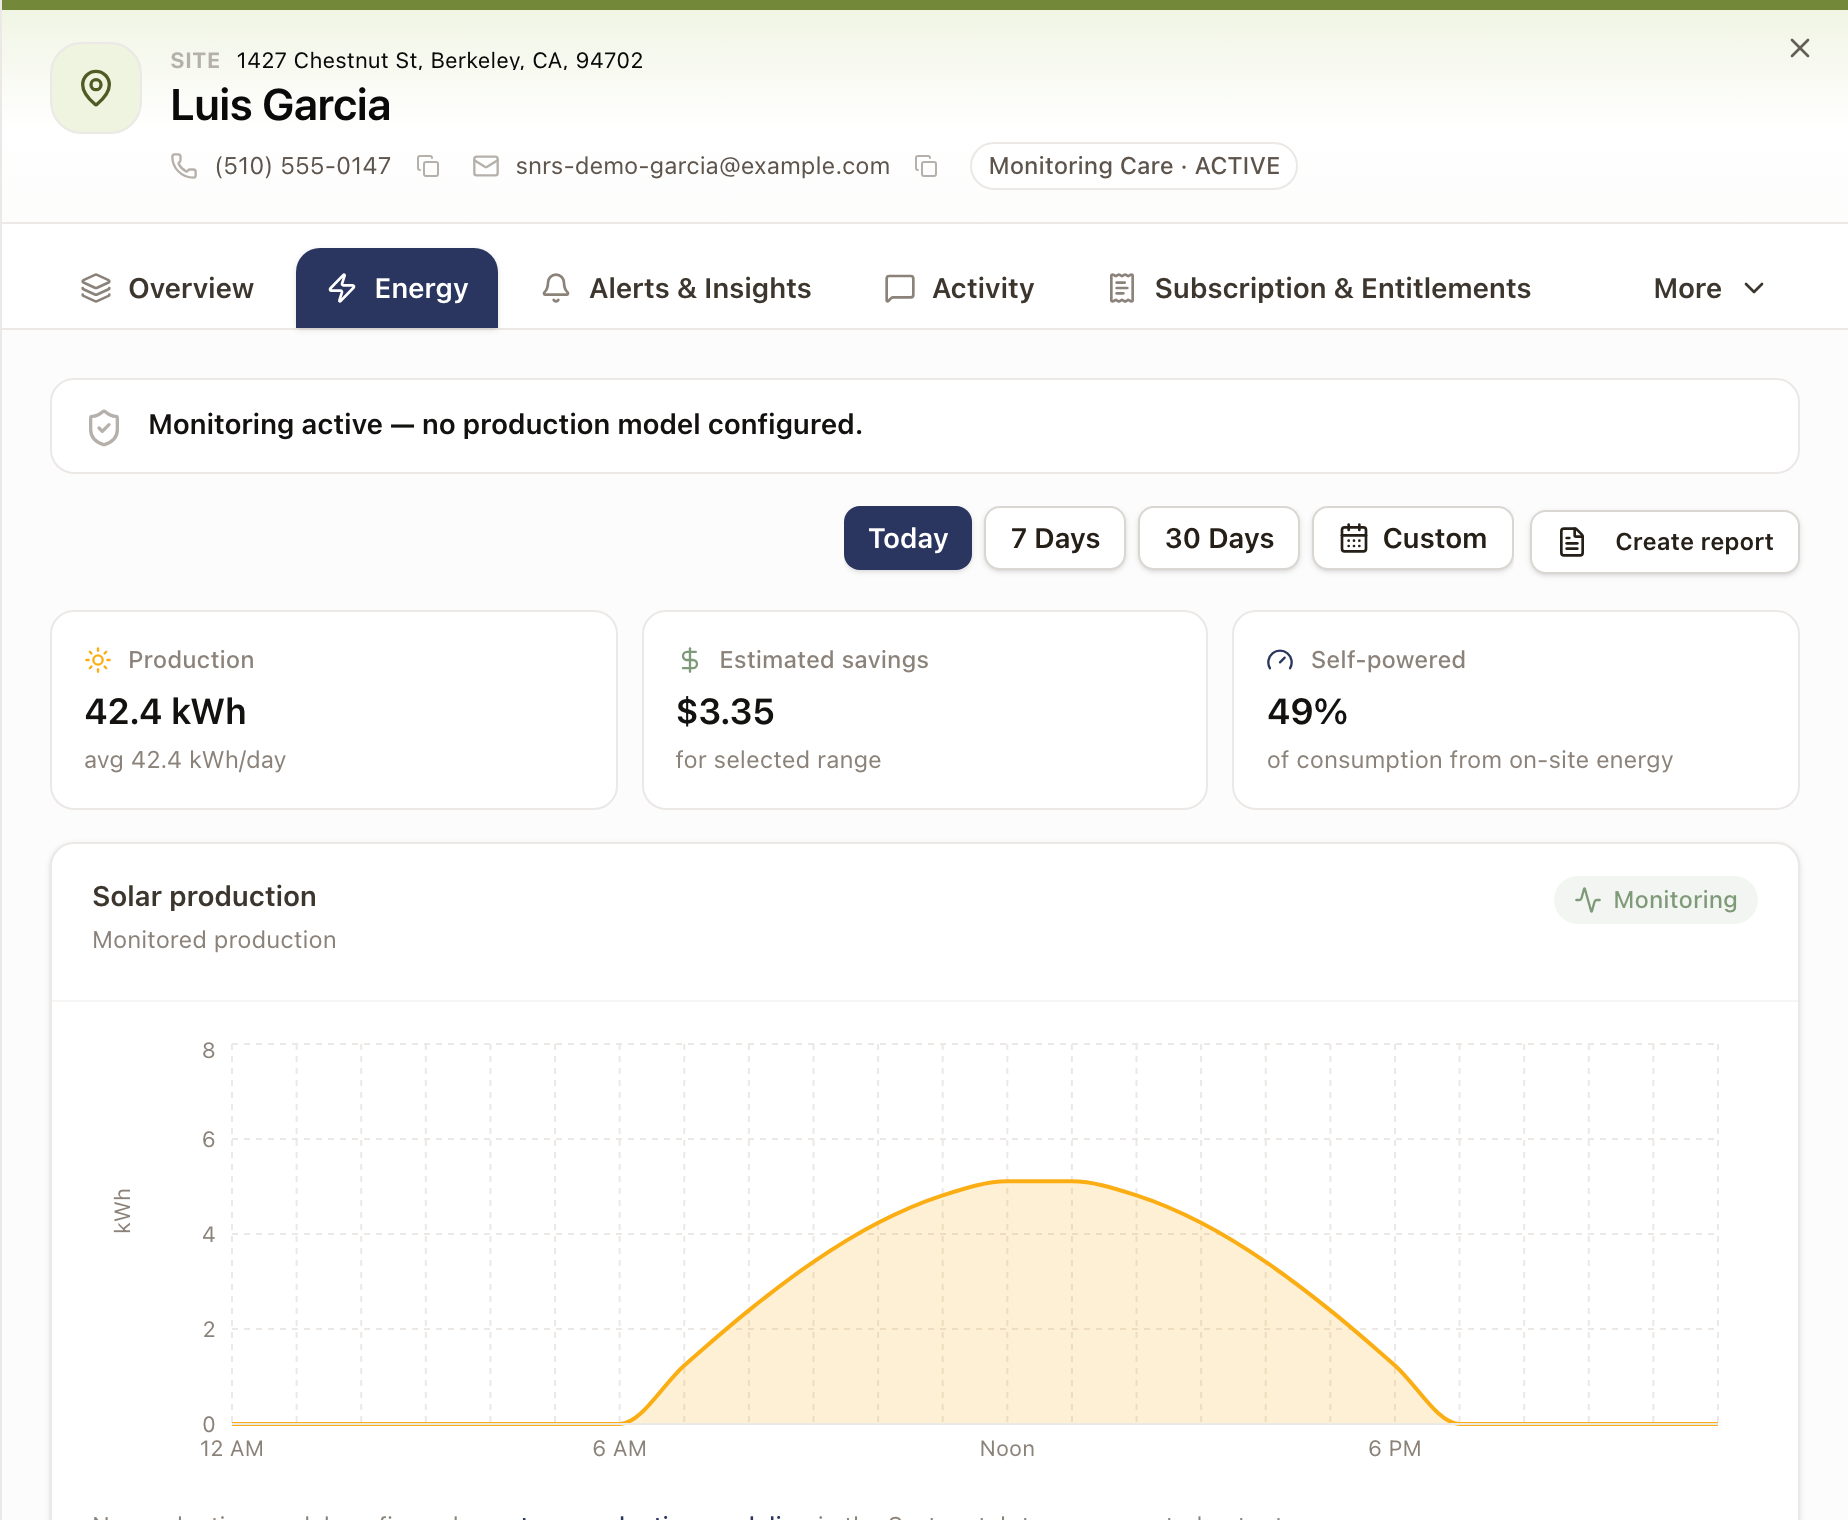
- Open the Energy tab to see production over Today, 7 Days, 30 Days, or a Custom range, plus estimated savings, self-powered percentage, and a Grid Flow chart. If the site has no production model set up, the chart says so instead of showing an expected-output line.
- The rest of the drawer's tabs cover specific tasks, so they get their own guides: Alerts & Insights (see Read and work an alert), Subscription & Entitlements (see Manage monitoring subscriptions and Fulfill an entitlement). Activity lists the site's notes, outreach, and lifecycle history.
- Open More → System to see or edit the equipment your team entered: system size, panel and battery counts, install date, and warranty expiration. This is separate from the synced devices on Overview; recording it here doesn't change what's synced, and a synced device won't change what you've recorded here either.
Create and send a site performance report
From the Energy tab, click Create report to build a one-time, point-in-time statement you can send a customer. Pick a Reporting period, an optional Report title, and which sections to include (Production, Expected vs. actual, Battery, Estimated savings, Service alerts, and an optional Note to customer). Click Generate preview to review it, then Copy link or Email to customer. Generating again always creates a new, separate report; past ones stay listed under Previously sent with an Open link.
Check it worked
The site's Health and Connection badges on the Sites list reflect its current device status. A report you sent appears under Previously sent on the Energy tab.
Common problems
Last sync looks old. Devices update about once an hour, so this is expected between syncs. A Stale tag next to the time means the site has gone quiet for longer than that. If a device has never synced, check its status on the Overview tab; it's either still connecting or genuinely disconnected.
A synced device shows "Not in the system definition yet." The device is connected and reporting, but doesn't match anything recorded on the System tab. Add a matching component there if you want the two to line up.